Assessing the Generation Process
To assess the benefits of incorporating the kinematic and dynamic model, we generated tests using no kinematic model, tests that used a maximum velocity to approximate the kinematic model, and tests that used the kinematic and dynamic model. The raw data for these tests can be found in the initial_run_flown folder. The full path directories for the raw data is shown below:
~/Artifact/RawData/initial_run_flown
Using a python script, we can analyze the raw data to answer RQ1. The python scripts are found in the ~/Artifact/ReproducingResults folder. To run the python script which analyzes the benefits of incorporating the kinematic and dynamic model run the following commands in the terminal:
cd ~/Artifact/ReproducingResults
python3 RQ1_GEN.py
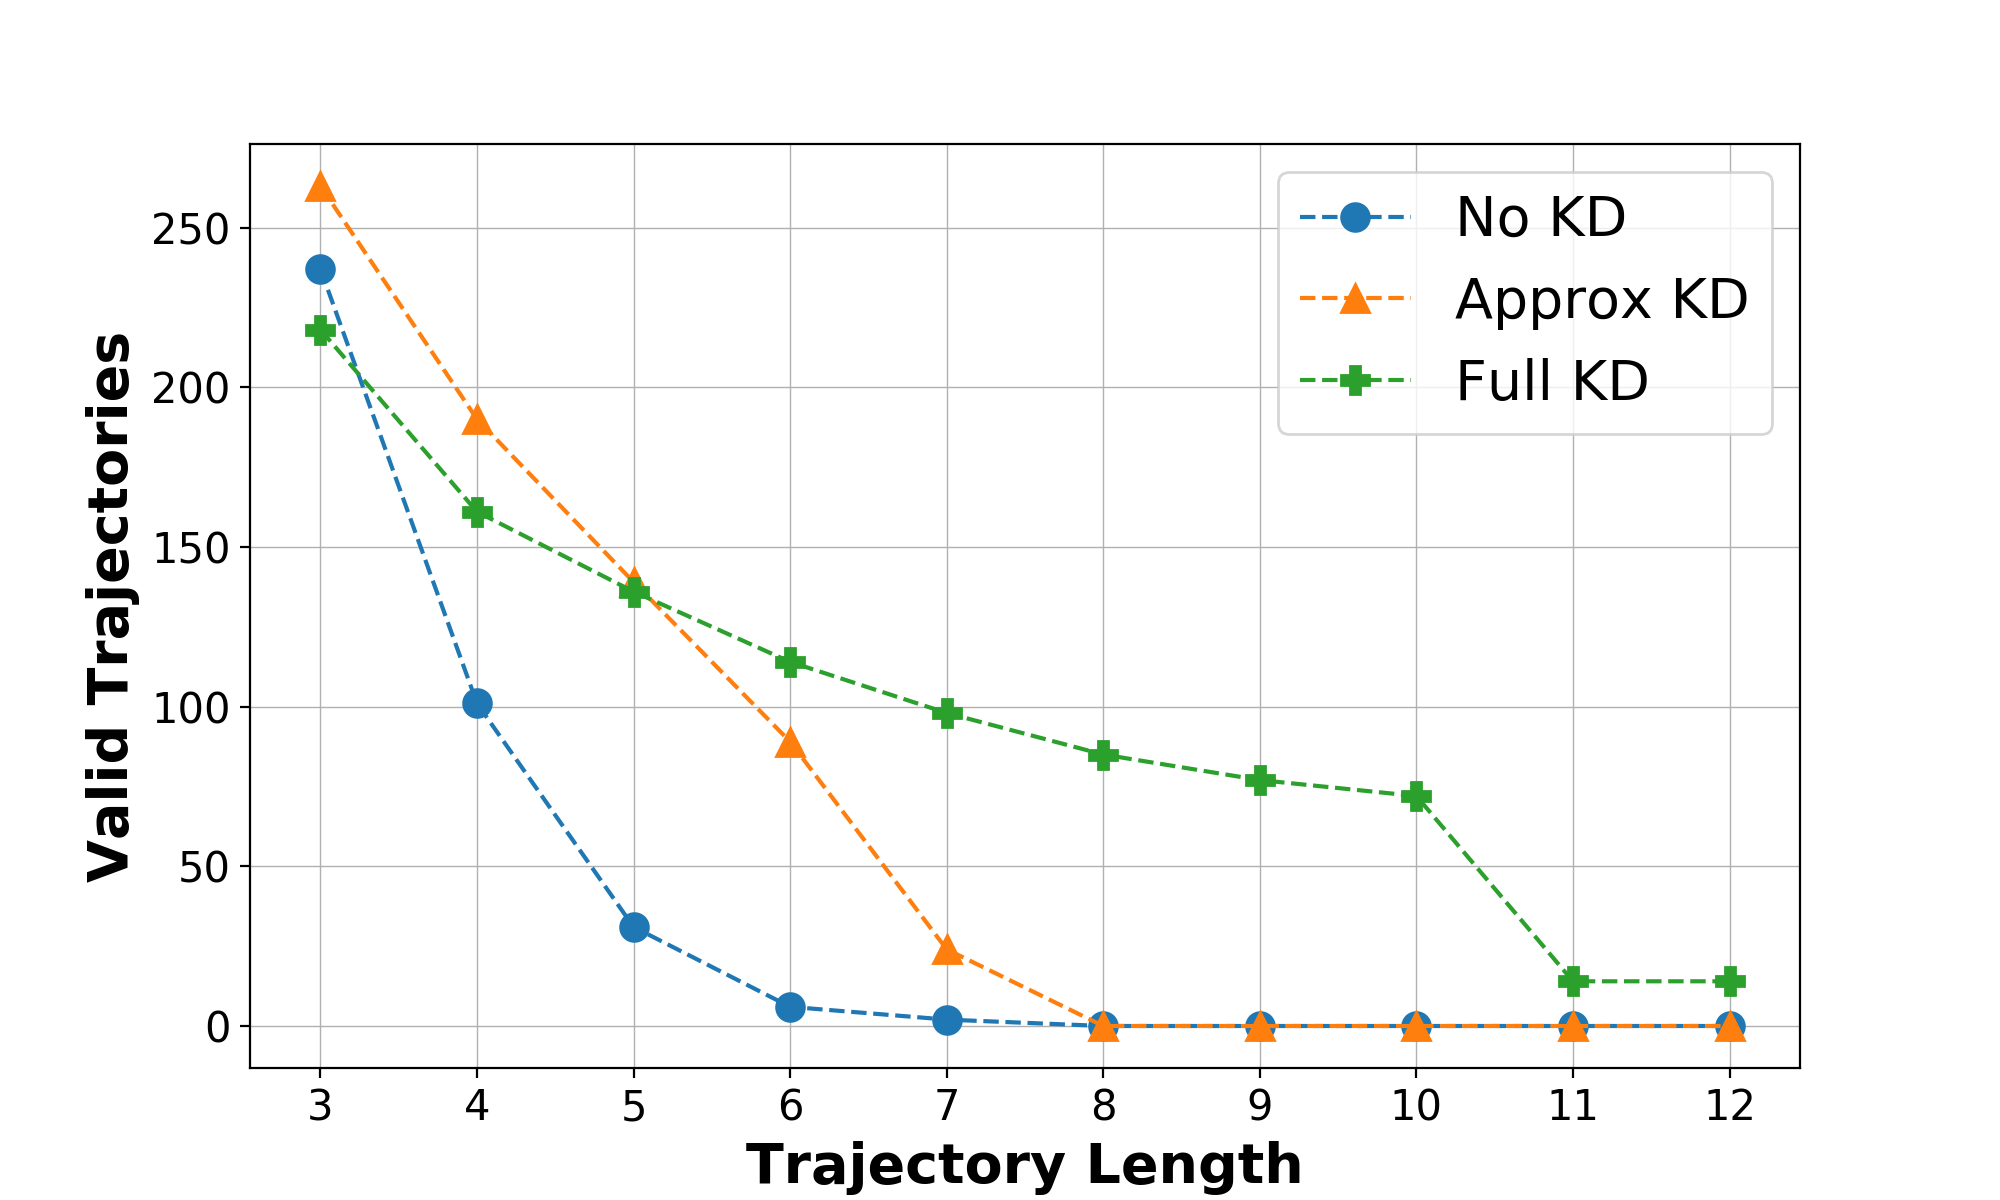
These commands will generate a figure that displays the total number of tests generated using each of the different techniques as we increase the trajectory length. (Figure 5 in the paper)
Assessing of Performance Metrics Obtained
The next step was to assess the performance metrics obtained when flying the quadrotor on the initial test suites. We analyzed the quadrotors performance on the tests that were generated using the kinematic and dynamic model without any scoring function. Additionally, we were interested in the test suite that had trajectories of length 10, as these allowed interesting test cases such as flying in loops. To view the raw data of these tests, you can look inside the following folder:
~/Artifact/RawData/initial_run_flown/initial_MIT_seed10_length10_nodes250_res4_beamwidth5_totaltime7200_simtime90_searchtype_kinematic_scoretype_random
We wrote a python script that parses this data to extract the maximum deviation, maximum acceleration, as well as the total time taken when executing the tests. To run that script, navigate to the ~/Artifact/ReproducingResults folder and run the following commands in the terminal:
cd ~/Artifact/ReproducingResults
python3 RQ1_METRICS.py
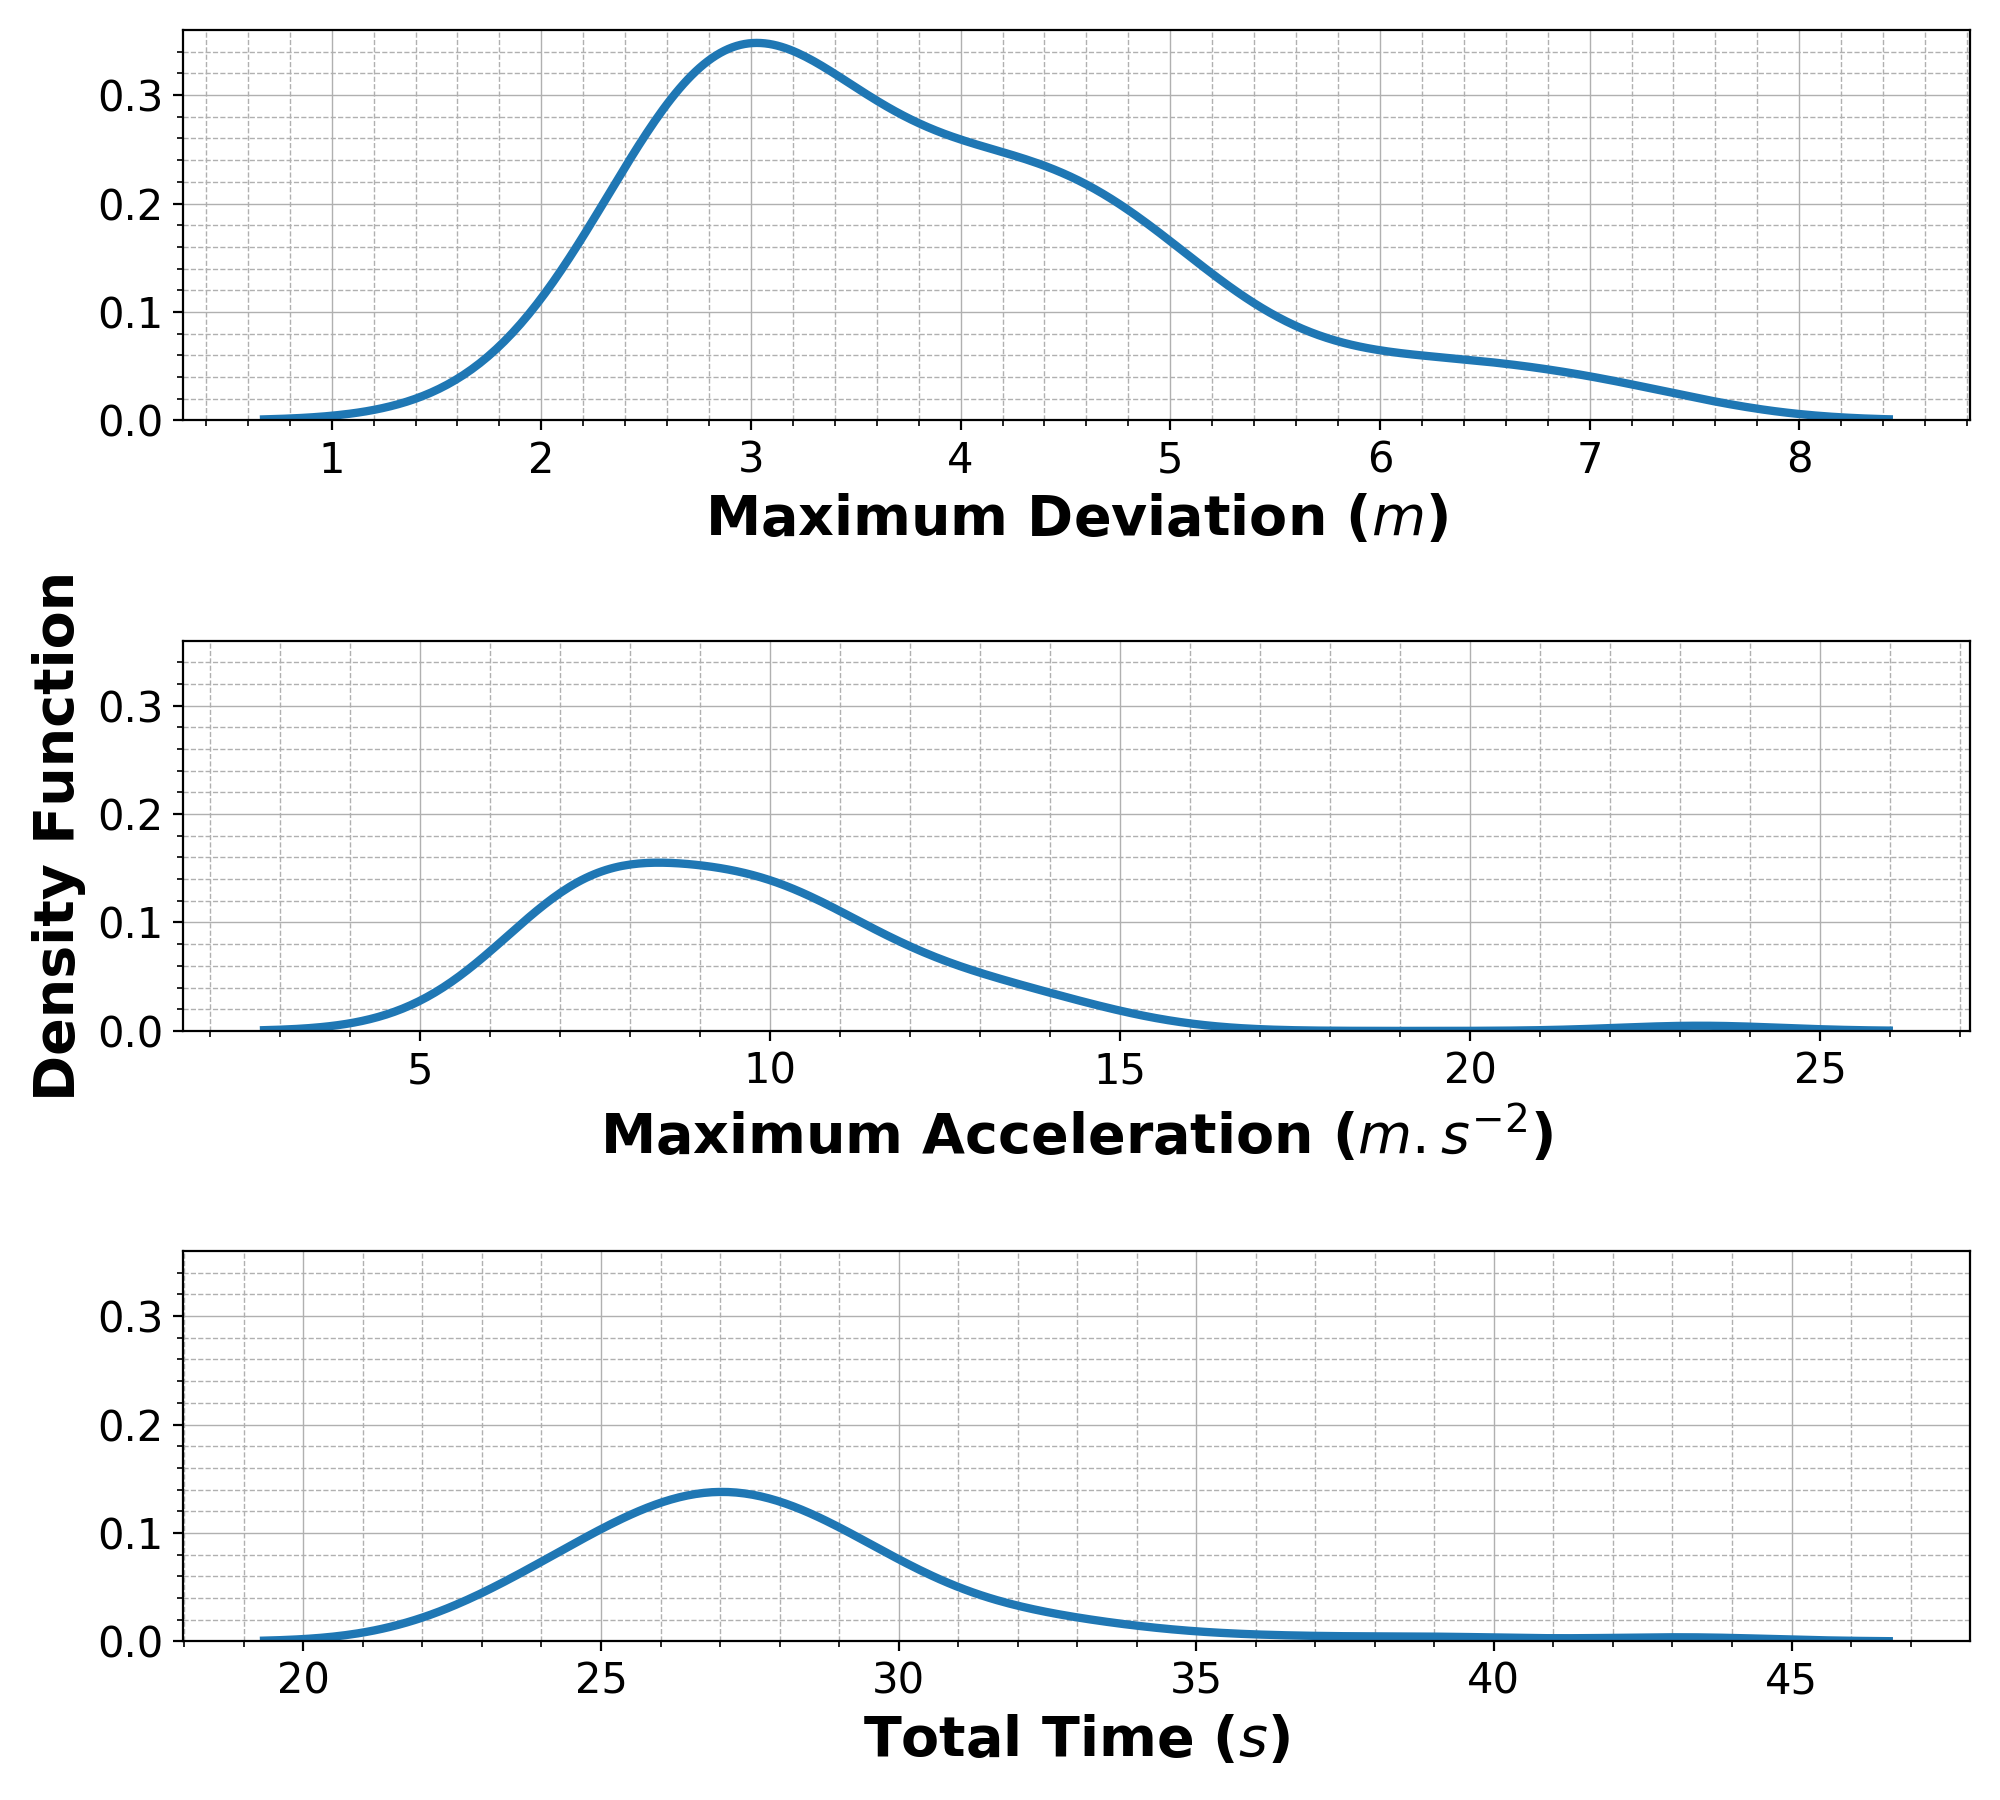
These commands will generate a figure that shows the distribution of the maximum deviation, maximum acceleration, and total time for the test suite. (Figure 6 in the paper)
Additional Analysis not Included in the Paper
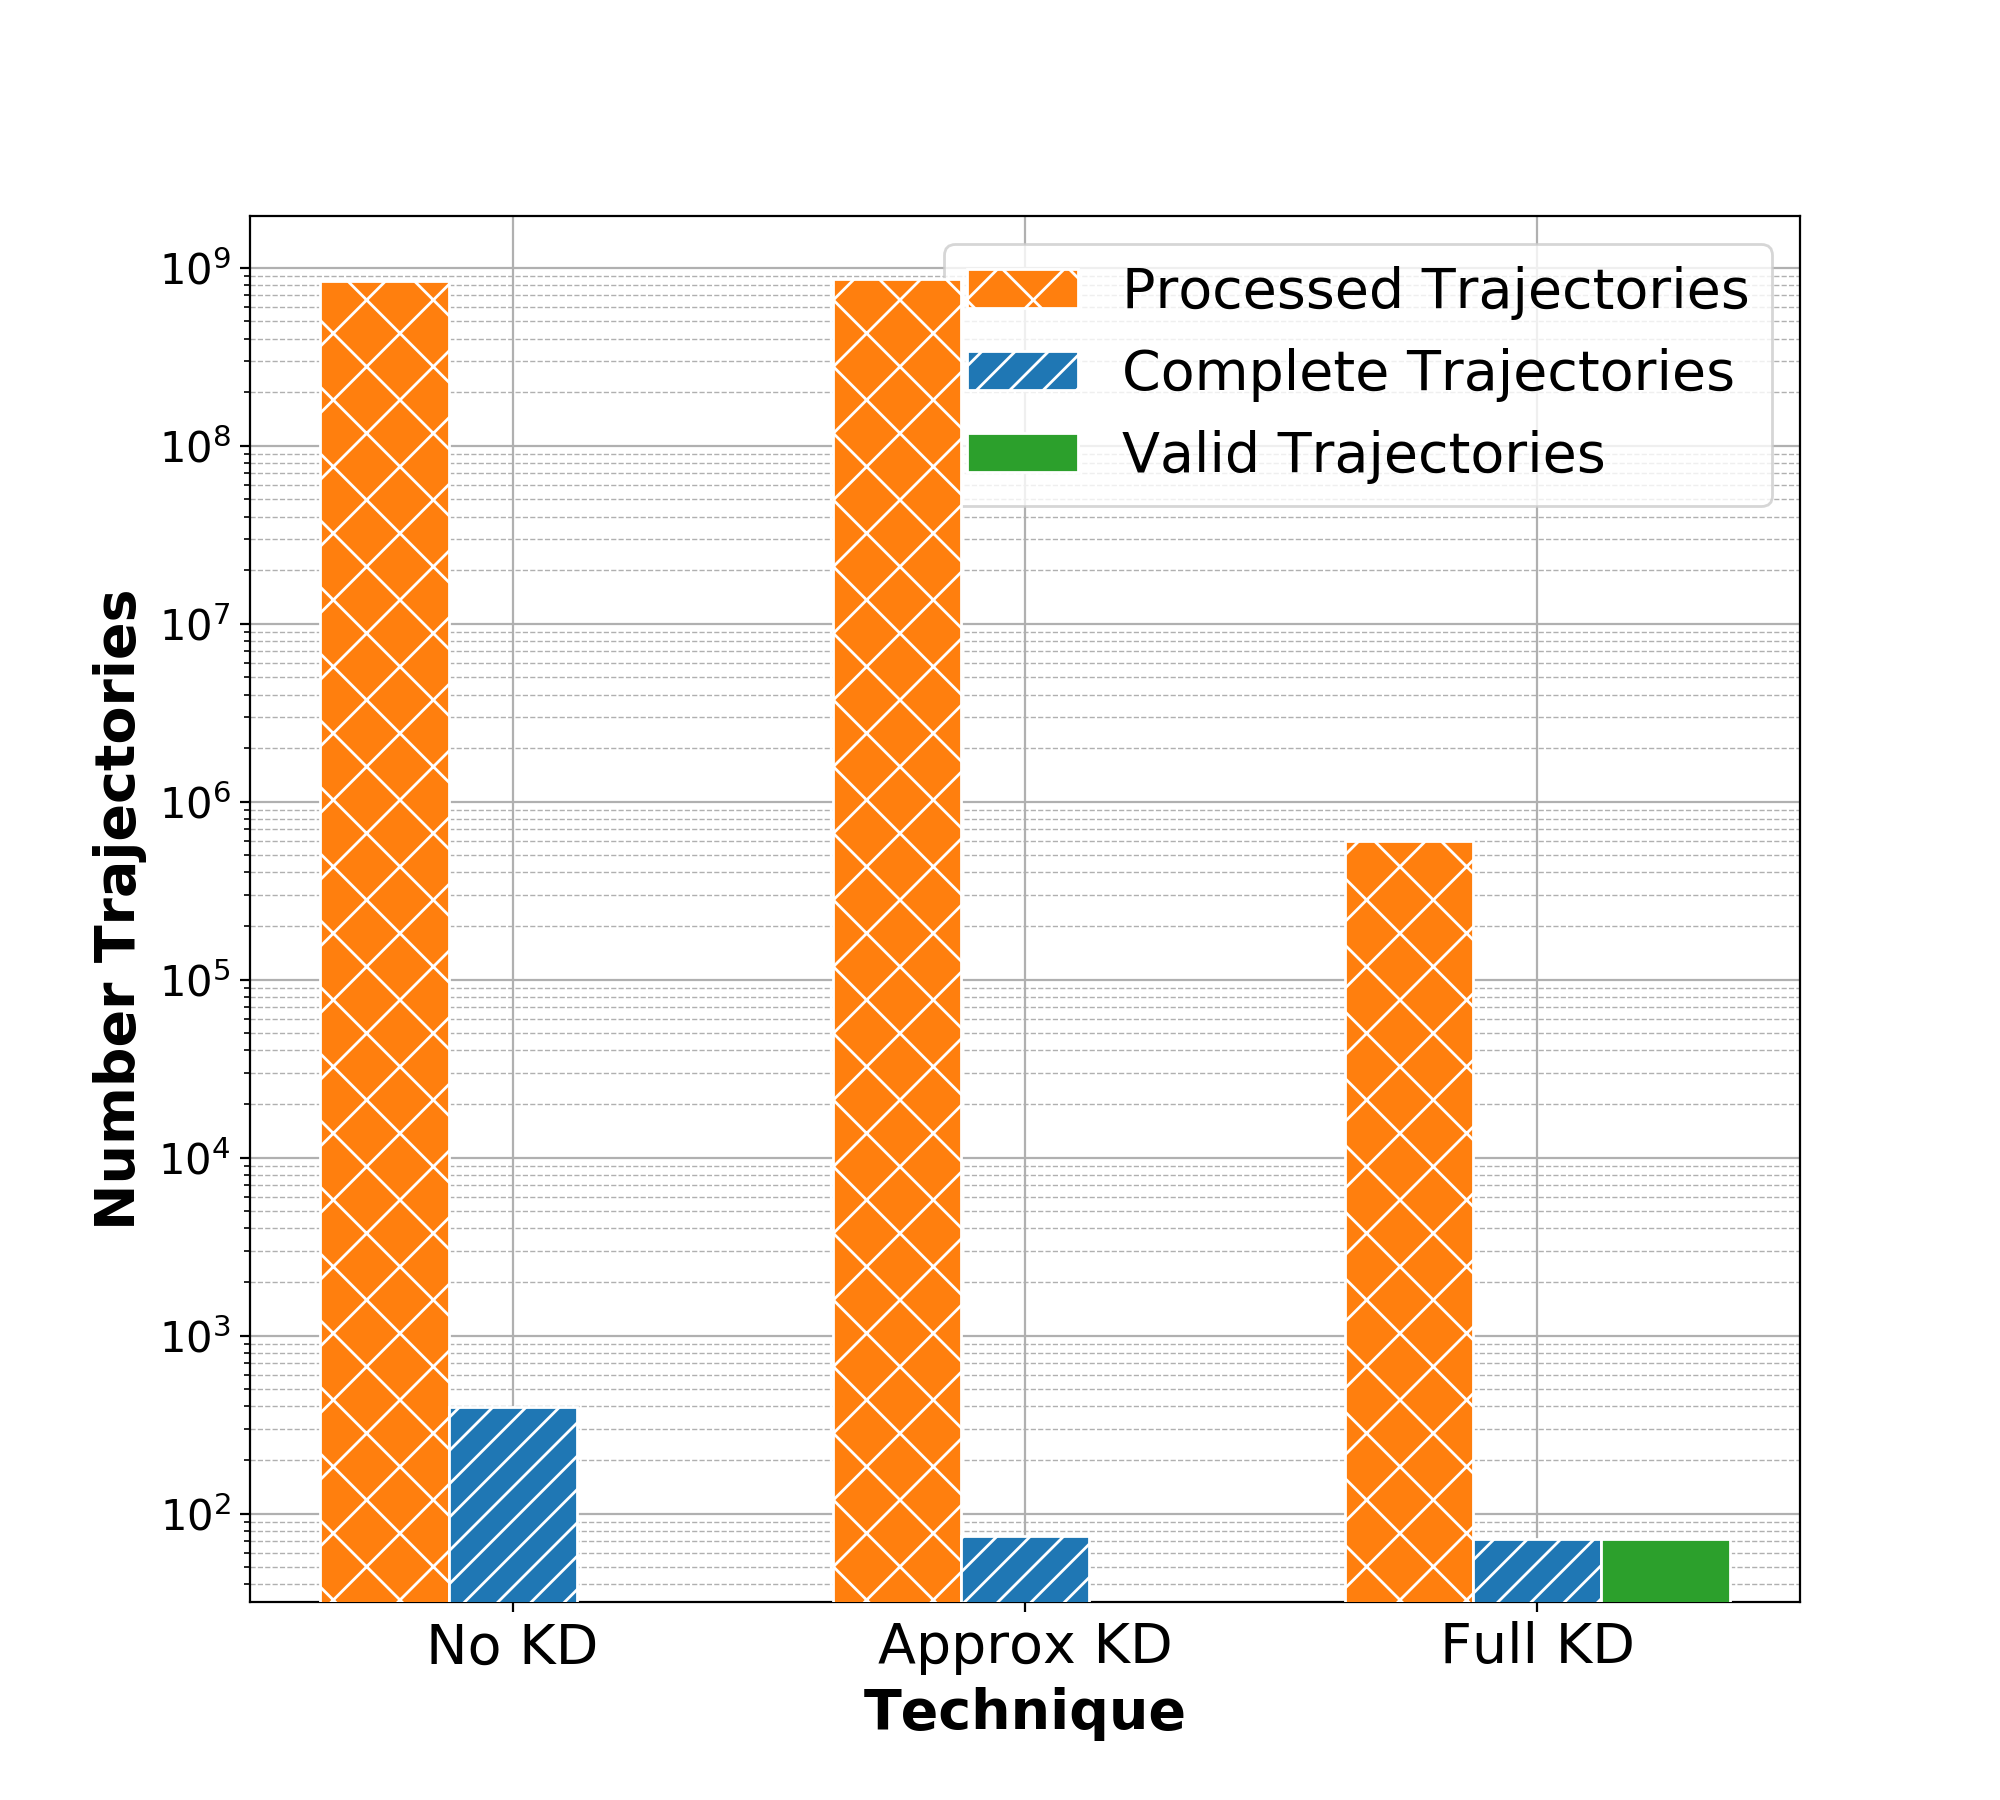
We show that there are additional ways to analyze the raw data from RQ1. Inside the RQ1_GEN.py python script we include a way to analyze the total number of process trajectories, complete trajectories as well as valid trajectories which is then plotted as a bar graph shown below:
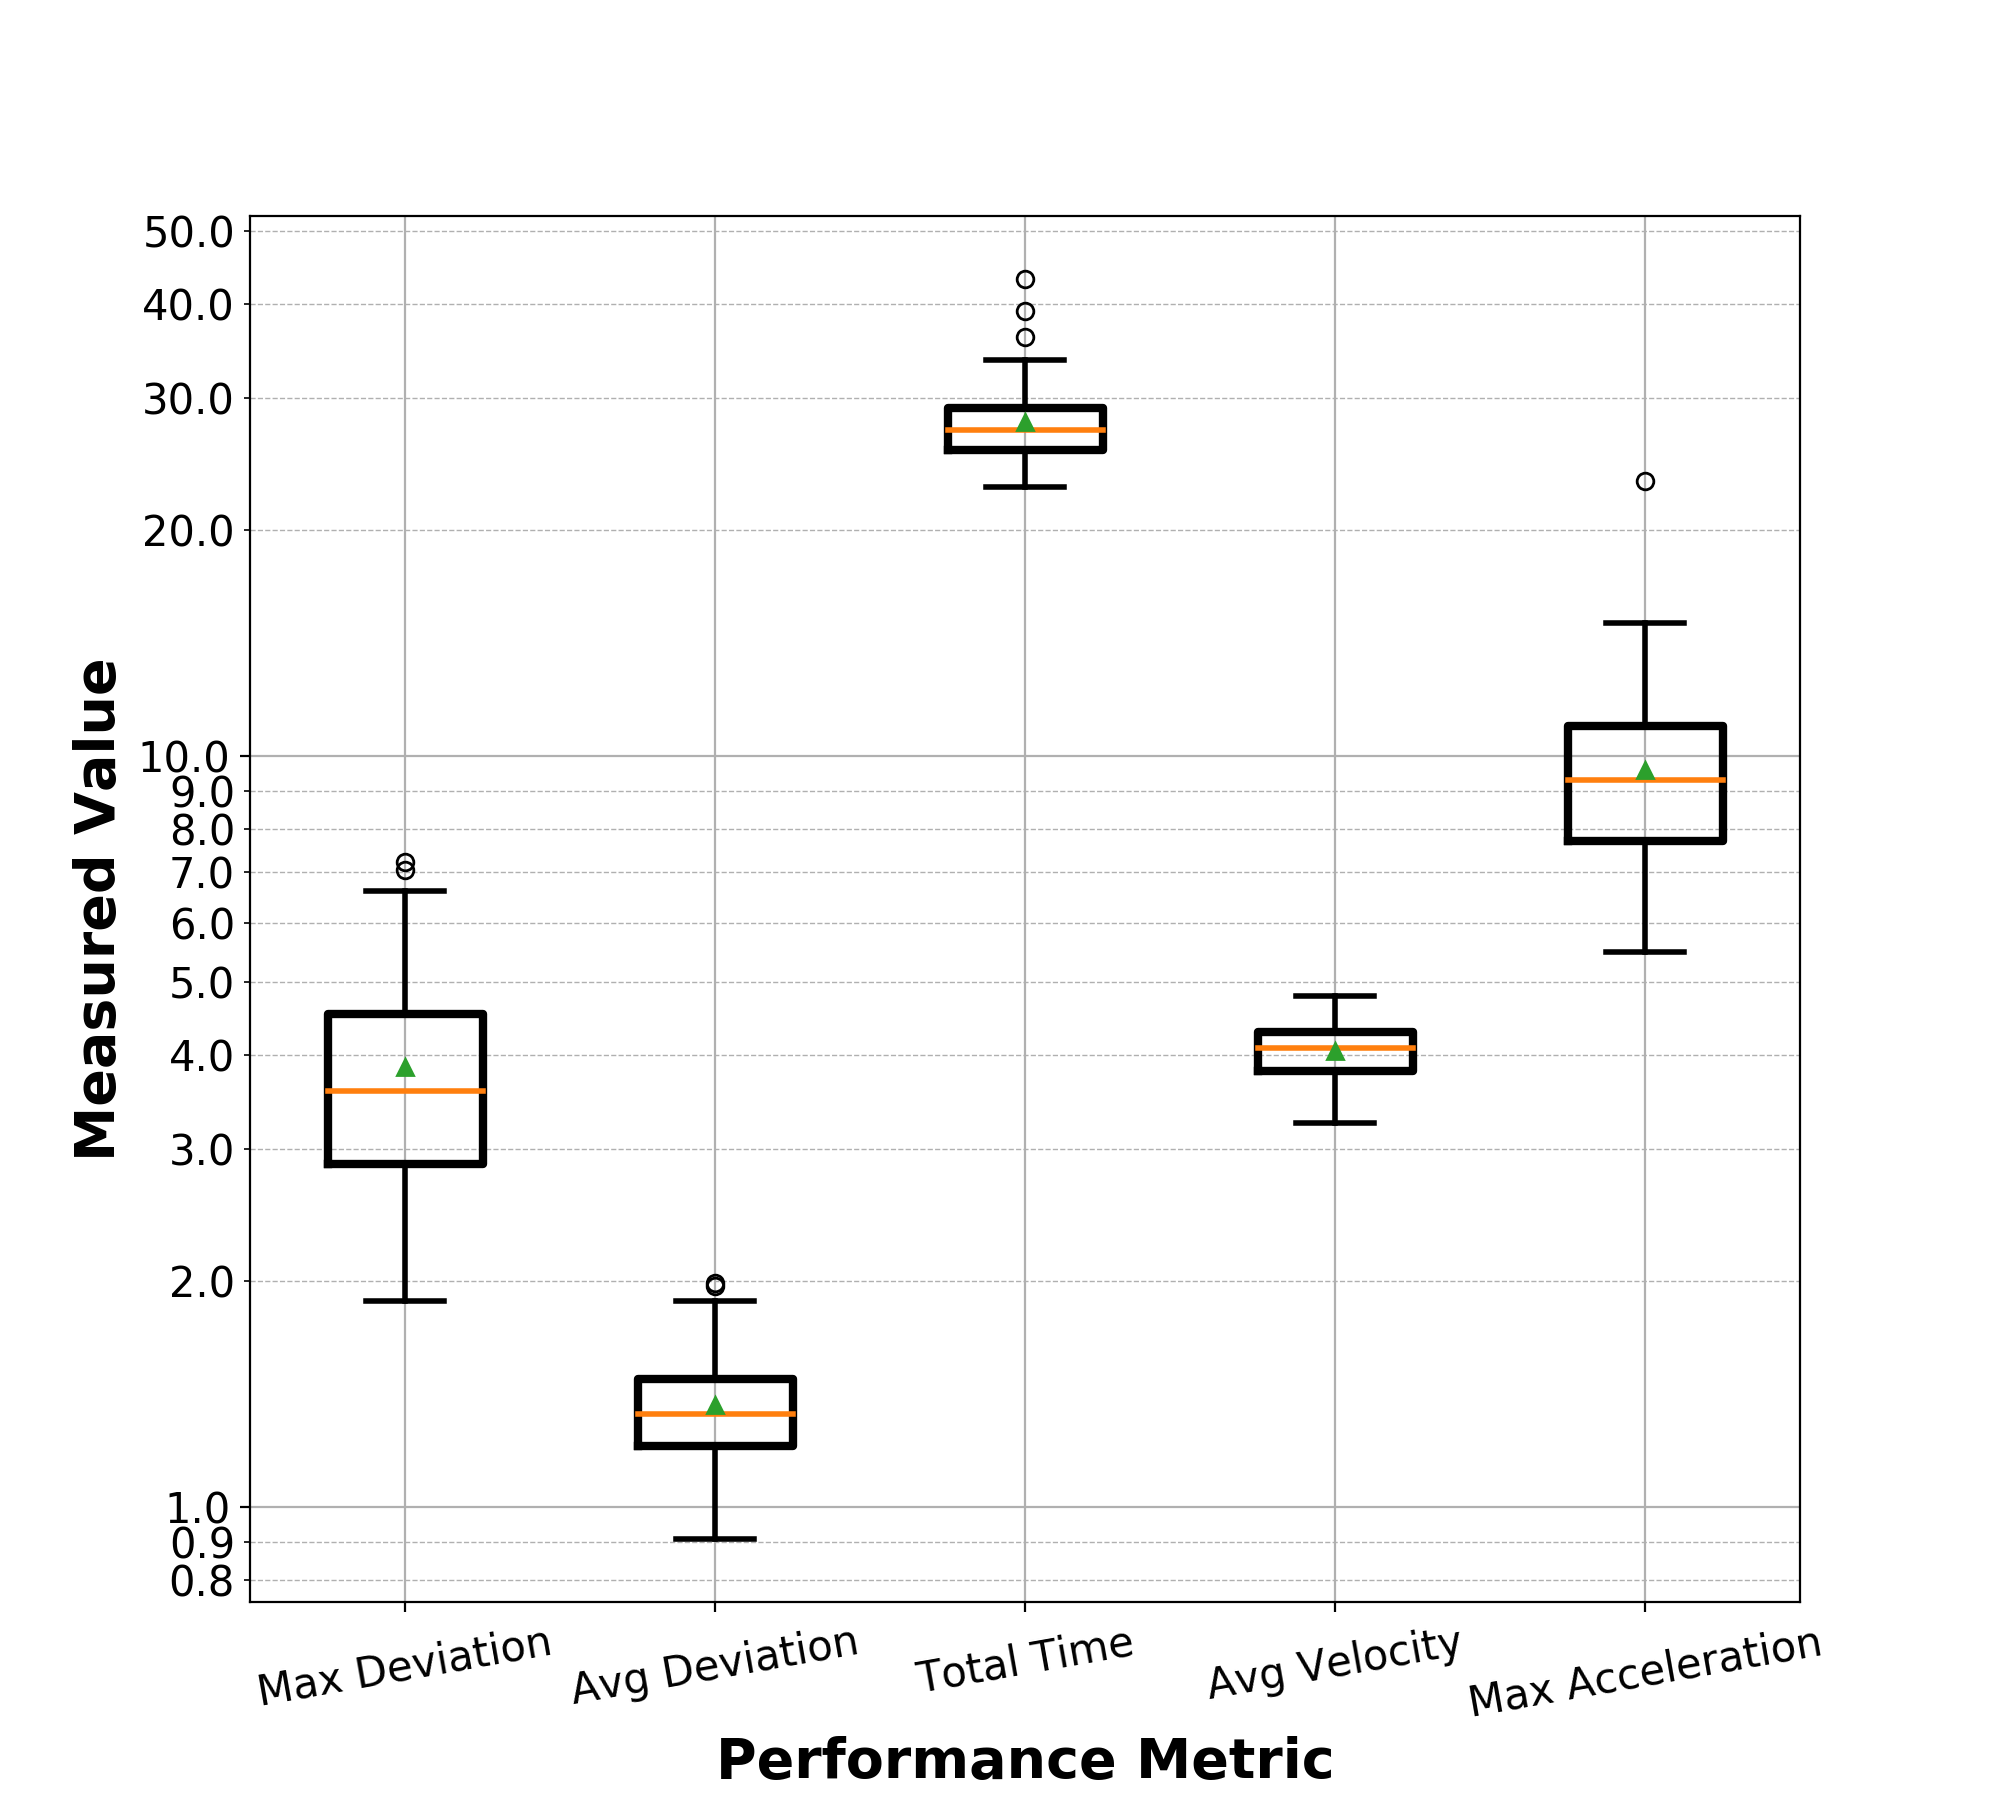
Inside the RQ1_METRICS.py python script, we include another way to view the data distribution using a box and whisker plot. The plot also contains additional metrics namely, the average velocity of the drone and the maximum acceleration of the drone.
Both these plots show that not only can we analyze the data in different ways, but we can extract additional information from the raw data if required.