Assessing the Scoring Models
To assess the scoring models, we created 3 handcrafted scoring models as well as a learned scoring model. We then compared this to the initial tests with no scoring model. The raw data for these experiments are in the folders handcrafted_run_flown and learned_run_flown. The initial test with no scoring model can be found in the initial_run_flown folder. Their full path directories are:
~/Artifact/RawData/initial_run_flown
~/Artifact/RawData/handcrafted_run_flown
~/Artifact/RawData/learned_run_flown
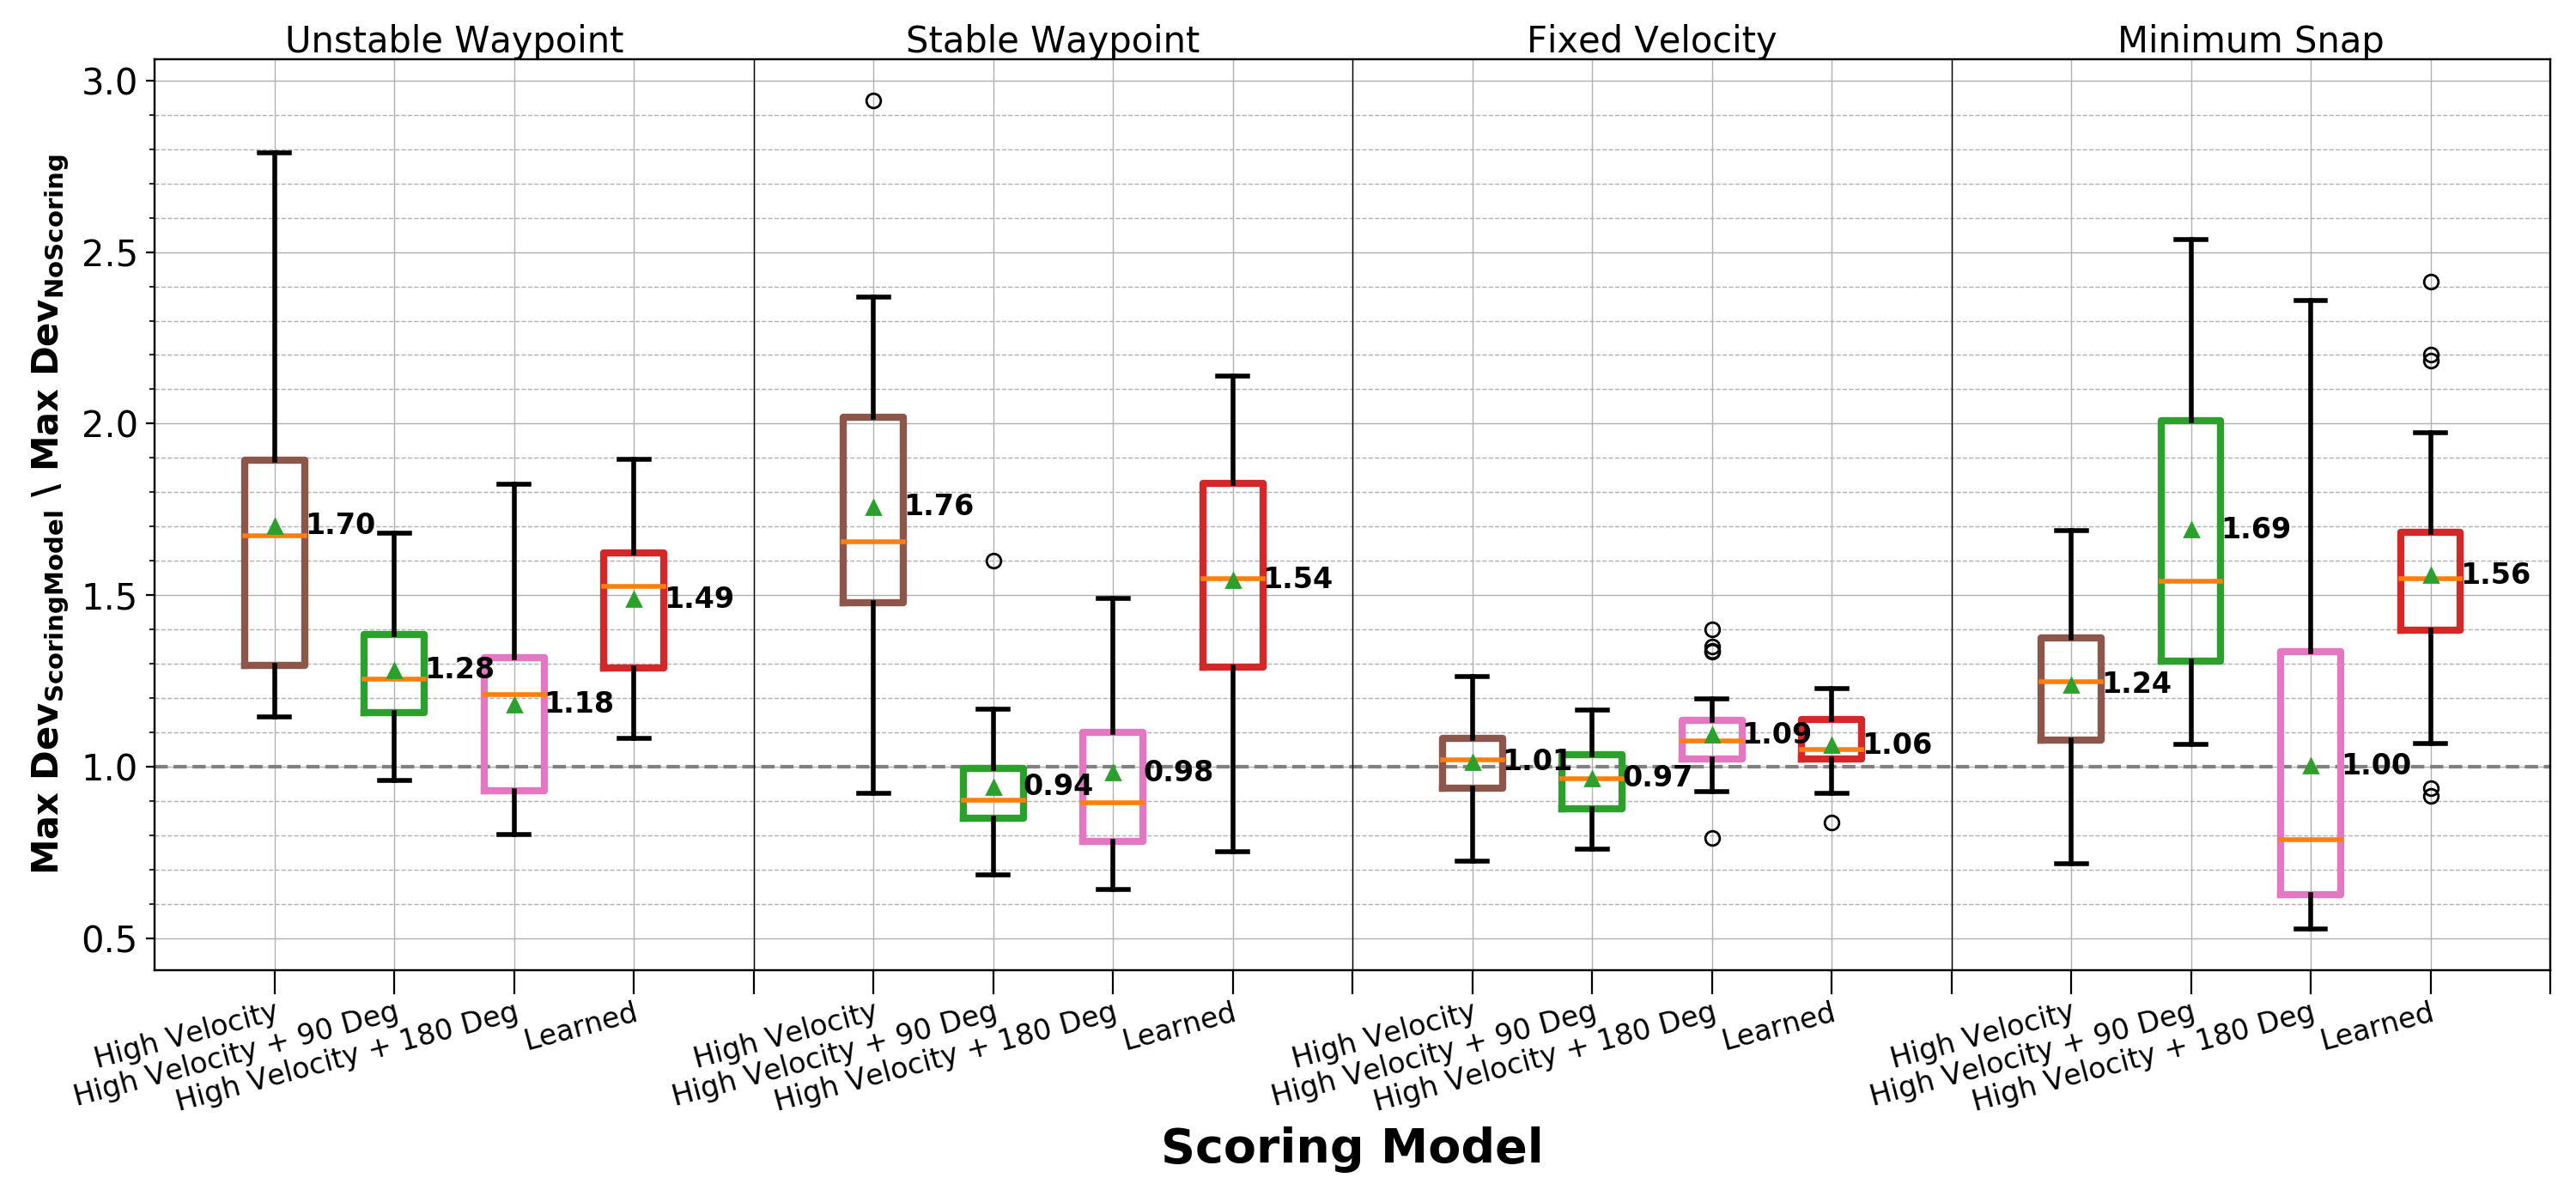
Using this data, we provide a script which parses the data and computes the maximum deviation from the optimal trajectory. It then displays the data as a ratio of the mean maximum deviation when no scoring model was used to the current mean maximum deviation. The script can be run using the following commands inside your terminal:
cd ~/Artifact/ReproducingResults
python3 RQ2.py
Using this, we can see the following output (Figure 7 in the paper). This output shows us that using a scoring model creates stress that, on average, is more stressful than using no scoring model.
Additional Analysis not Included in the Paper
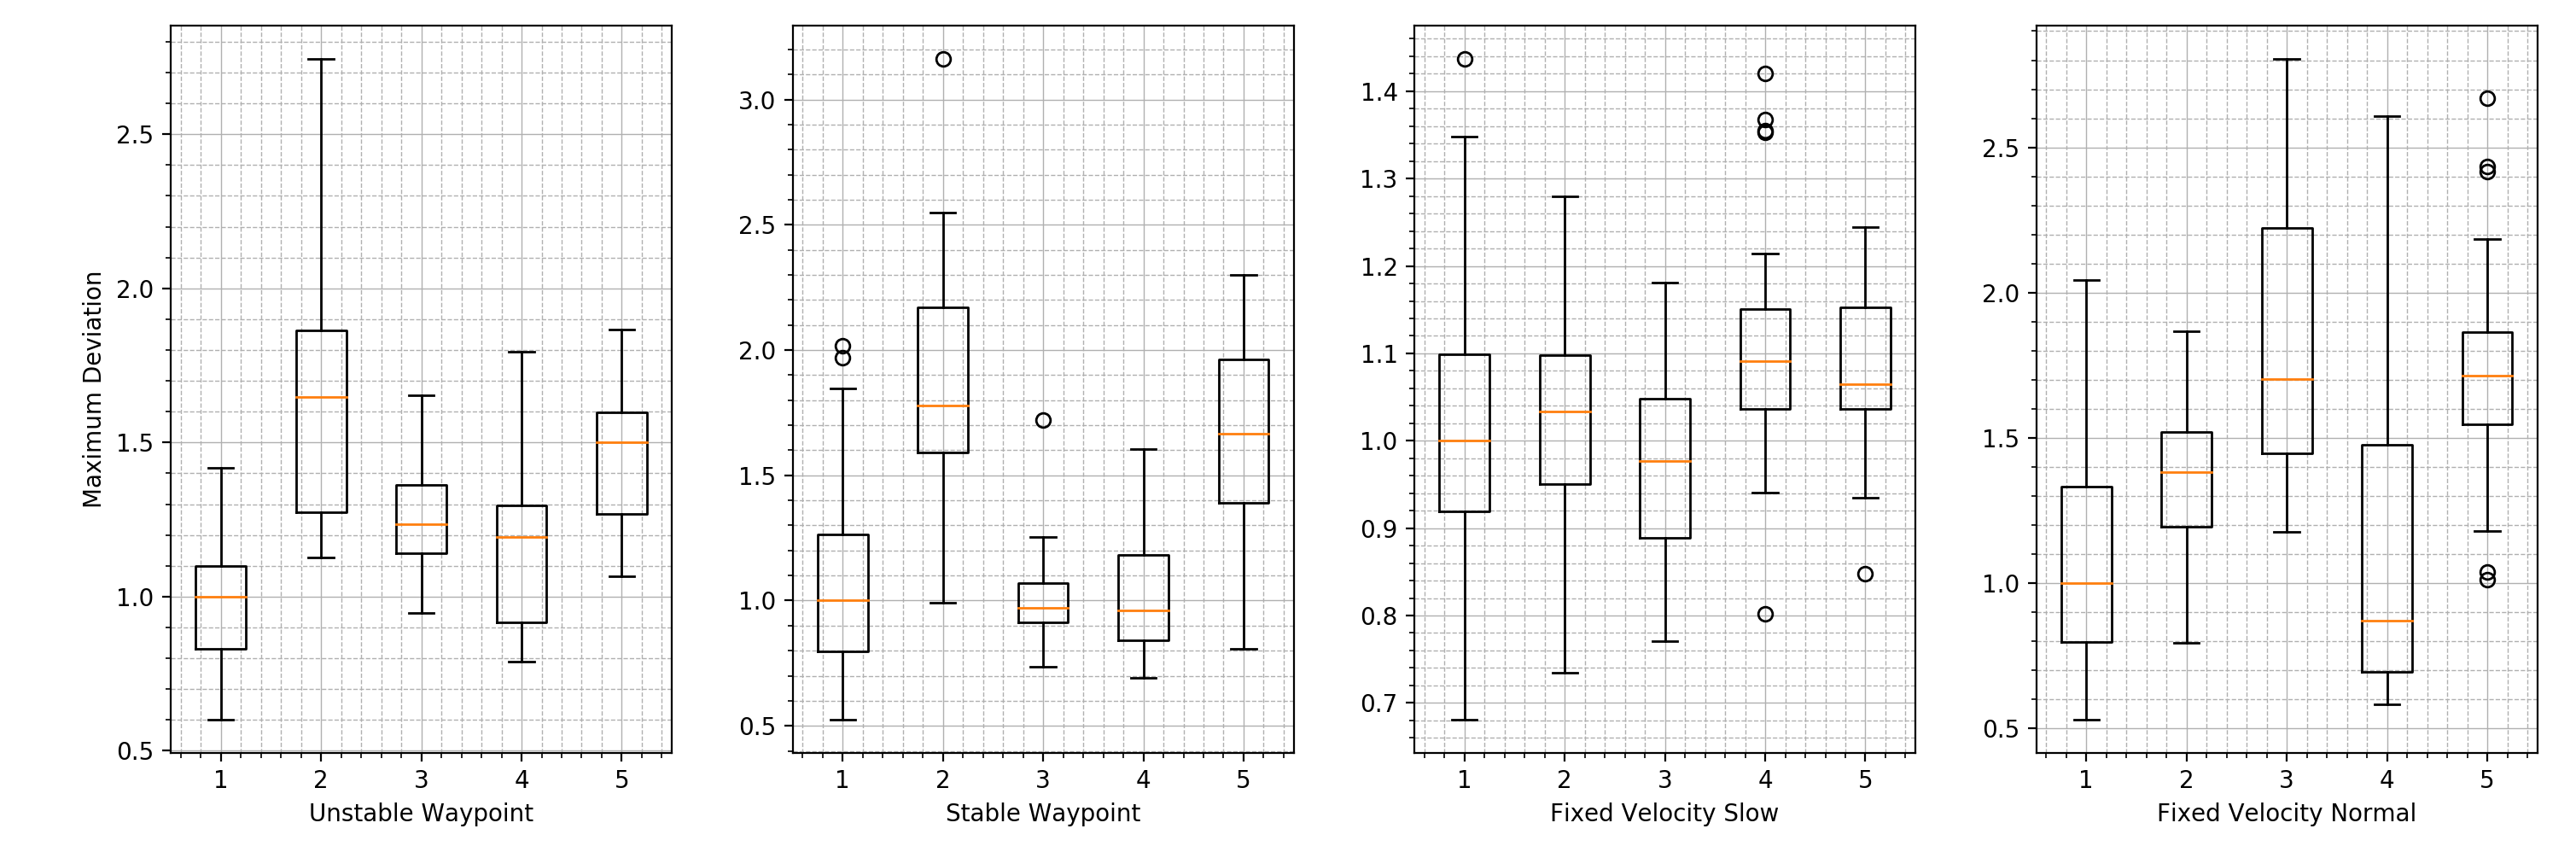
We show that there are additional ways to present and analyze the data presented for RQ2. For instance, inside the RQ2.py script, we include a way to include the visualization of the initial test set. When running the RQ2.py script, you will also be presented with the following figure, which shows the initial test set marked using a 1: